
Grip Strength Standards by Age and Sex (2026 Chart)
This article may contain affiliate links. If you buy through them, we may earn a small commission at no extra cost to you. See our Affiliate Disclosure and Medical Disclaimer.
Grip strength has become one of the most talked-about numbers in longevity circles, and for good reason — it’s one of the easiest physical measurements to take, and it correlates with outcomes ranging from fall risk to all-cause mortality. But almost none of the popular coverage answers the actual practical question: what number counts as normal, low, or strong for someone your age and sex? This article is a straight answer to that, built from the largest normative datasets that exist, not a single gym’s informal chart.
If you want the research case for why grip strength matters as a health marker in the first place, we’ve covered that in detail in our piece on grip strength as a longevity marker. This article focuses specifically on the numbers: what’s typical by decade and sex, where those numbers come from, and how to measure yourself correctly so the comparison actually means something.
Related: What Is “Metabolic Age” and Can You Actually Lower It?
The Biggest Dataset: 2.4 Million Adults, 69 Countries
The most comprehensive source available is a 2025 systematic review and pooled analysis published in the Journal of Sport and Health Science (Tomkinson et al., 2025, https://pubmed.ncbi.nlm.nih.gov/39647778/). The research team — an international collaboration spanning dozens of institutions — combined data from 100 separate observational studies representing 2,405,863 adults aged 20 to 100+, tested from the year 2000 onward across 69 countries and regions.
Related: MEV, MAV, MRV
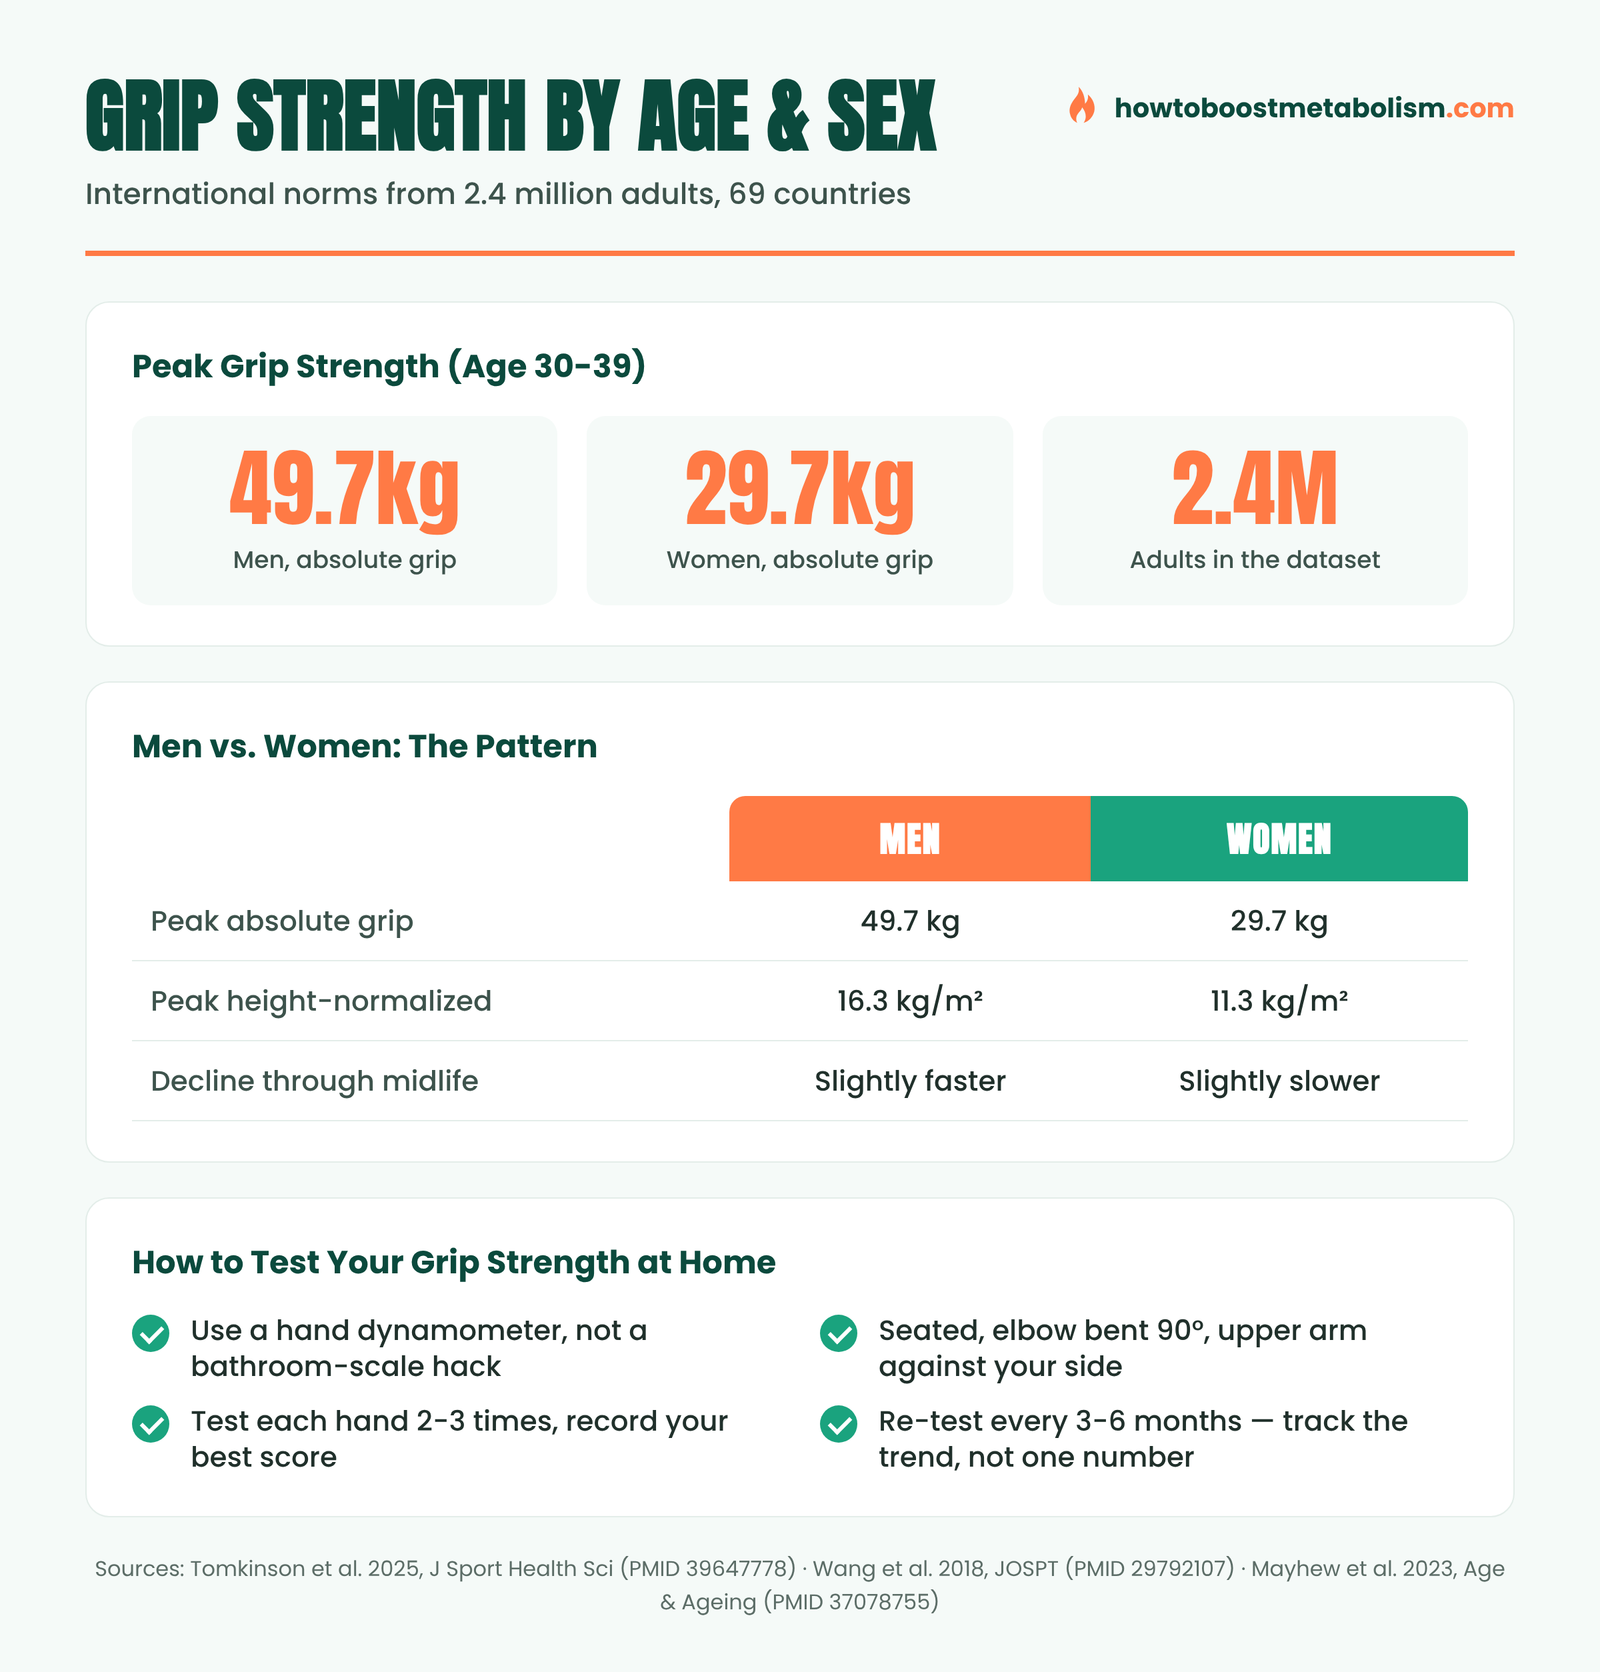
Their headline finding: average handgrip strength improves slightly through early adulthood, peaks between ages 30 and 39 at 49.7 kg for men and 29.7 kg for women (absolute grip strength), and declines afterward. When grip is normalized for height — which controls for the fact that taller people tend to have bigger hands and levers — the peak values are 16.3 kg/m² for men and 11.3 kg/m² for women. Critically, the decline doesn’t happen at a constant rate: it accelerates from middle to late adulthood, and the researchers found the rate of decline was slightly steeper for men than for women specifically during middle adulthood.
That last point is worth sitting with if you’re a man in your 40s or 50s: the data suggests this is close to the exact window where the decline curve starts bending downward faster, which is precisely when building a grip-training habit pays off most.
Related: Vitamin D and Muscle Strength After 40
The US-Specific Numbers
International averages are useful for context, but a US-specific reference is more directly applicable if you’re an American reader comparing your own numbers. The most widely cited US dataset comes from the NIH Toolbox normative project, analyzed and published separately (Wang et al., 2018, Journal of Orthopaedic & Sports Physical Therapy, https://pubmed.ncbi.nlm.nih.gov/29792107/). Using grip data from 1,232 US residents aged 18 to 85, the researchers found mean grip strength ranging from 49.7 kg for the dominant hand of men aged 25-29 down to 18.7 kg for the nondominant hand of women aged 75-79 — essentially bracketing the entire lifespan curve between those two values.
That paper also provides regression equations using age, height, and weight as inputs, which clinicians use to generate individualized reference ranges rather than a single one-size-fits-all number per decade. The practical takeaway for a general reader: your own expected grip strength depends on more than just your age bracket — your height and body size shift the “normal” range meaningfully, which is exactly why generic social-media grip-strength charts tend to be oversimplified.
Free download
🔥 The Metabolism Starter Kit
3 honest guides: a 7-day reset plan, a foods cheat-sheet and 12 metabolism myths debunked. No spam — unsubscribe anytime.
Why Country-Specific Data Matters More Than People Assume
One nuance that’s easy to miss: normative grip data doesn’t transfer cleanly across populations. A Swiss normative study of 1,023 adults aged 18 to 96 found that hand strength values differed significantly from other published populations, and the authors explicitly concluded that applying one country’s reference values internationally is questionable (Werle et al., 2009, Journal of Hand Surgery (European Volume), https://pubmed.ncbi.nlm.nih.gov/19129352/). Differences in occupational demands, average body size, and testing protocols all contribute. This is part of why we’re leading with the international meta-analysis and the US-specific dataset here, rather than a single chart borrowed from one small study of a different population.
Why Grip Strength Declines in the First Place
Grip strength isn’t a single, isolated muscle quality — it’s the end product of motor neuron density, forearm and hand muscle cross-sectional area, tendon stiffness, and nervous-system efficiency all working together. Age-related decline in grip reflects the same underlying process behind broader sarcopenia (age-related muscle loss): a gradual drop in motor unit number and size that tends to accelerate once someone becomes sedentary, and that accelerates further after roughly age 50-60 in most populations studied. The encouraging part, repeated consistently across the strength-training literature, is that resistance training blunts this decline meaningfully at any age it’s been studied — grip is a trainable trait, not a fixed sentence handed down by your birth year.
This is also why a single grip-strength number, taken in isolation on one bad or dehydrated day, tells you less than a trend tracked over months. Sleep quality, recent training volume, hand fatigue from manual work, and even time of day can shift a single reading by several kilograms without reflecting any real change in your underlying strength.
Common Mistakes That Skew Your Number
- Testing with your arm straight out in front of you instead of at your side — this changes leverage and typically under-reports true grip strength compared to the standardized position used in the research above.
- Comparing your single best attempt to someone else’s average of several attempts (or vice versa) — be consistent about which metric you’re tracking.
- Testing right after a hard forearm or pulling-focused training session, when your hands are already fatigued — this will read artificially low and isn’t comparable to a fresh-state reading.
- Relying on a cheap spring-loaded “grip trainer” gadget instead of a calibrated dynamometer — these tools are fine for training, but their resistance curve isn’t the same as what normative research studies actually measured.
- Panicking over a single below-average session instead of looking at a multi-month trend, which is a far more meaningful signal of real strength change.
A Reference Built Specifically for 45-85 Year-Olds
Since this audience skews toward readers actively managing midlife and older-adult health, the Canadian Longitudinal Study on Aging is a particularly relevant source. It derived normative values for grip strength, gait speed, and several other functional tests from a large population-based sample of Canadians aged 45 to 85 (Mayhew et al., 2023, Age and Ageing, https://pubmed.ncbi.nlm.nih.gov/37078755/). The explicit goal of that project was to give clinicians an easy way to flag when an older adult’s measured strength falls meaningfully below what’s typical for their age and sex — exactly the comparison most readers want to make for themselves at home.
At a Glance: Where the Big Numbers Come From
| Question | Finding | Source |
|---|---|---|
| Peak grip strength (international) | ~49.7 kg men / ~29.7 kg women, ages 30-39 | Tomkinson et al. 2025 (PMID 39647778) |
| US dominant-hand range (18-85y) | 18.7 kg to 49.7 kg across the lifespan | Wang et al. 2018 (PMID 29792107) |
| 45-85y normative reference | Age- and sex-specific percentiles | Mayhew et al. 2023 (PMID 37078755) |
| Population specificity matters | Swiss data differed from other countries’ norms | Werle et al. 2009 (PMID 19129352) |
How to Actually Test Yourself (So the Comparison Means Something)
Every normative study above used a calibrated hand dynamometer and a standardized testing position — details that matter more than most people assume, because sloppy technique can shift your number by several kilograms in either direction.
- Sit upright in a chair with no armrests, feet flat on the floor.
- Hold the dynamometer with your elbow bent at roughly 90 degrees and your upper arm resting against your side — not held out in front of you.
- Squeeze as hard as you comfortably can for 2-3 seconds; don’t jerk or swing your arm into it.
- Test each hand 2-3 times with a short rest between attempts, and record your single best score per hand, not an average.
- Note your dominant vs. nondominant hand separately — the research above shows a consistent gap between them, so mixing the two muddies your own tracking.
If you don’t own a dynamometer, inexpensive digital models are widely available and are what most of the studies above actually used in the field — a bathroom scale squeeze or a “grip trainer” spring tool won’t give you a number that’s comparable to any published reference range.
It’s also worth testing on a day that’s reasonably representative of your normal routine — not immediately after a long flight, a night of poor sleep, or a day of heavy manual labor, all of which can temporarily suppress grip output independent of your actual underlying strength. If you want a truly stable baseline, average three separate test sessions spread across a couple of weeks rather than anchoring on a single visit.
What to Do If Your Number Is Below Average
A below-average reading isn’t a verdict — grip strength is, encouragingly, one of the more trainable physical markers available, as we cover in more depth in our grip-strength longevity piece. Two training approaches with real evidence behind them: structured dead hangs and hangboard-style grip work, introduced gradually and with attention to the injury risks we cover separately, and loaded carries such as farmer’s walks, which train grip endurance under a real training load rather than isolation. Both fit naturally into an existing strength routine rather than requiring a separate “grip day.”
Grip strength is also just one piece of a broader strength-and-cardio picture worth tracking together — see our guide on VO2 max and strength training for longevity if you want the fuller context on how these markers tend to move together as you age.
One note specifically for women: the absolute numbers above are consistently lower than men’s at every age bracket, which is a function of average muscle cross-sectional area, not a ceiling on how trainable your own grip is. The relative pattern of decline and response to training looks similar across sexes in the data reviewed here — what differs is the starting baseline, not the capacity to improve it. If strength-training in general is new to you, our piece on whether lifting weights makes women “bulky” addresses a related myth that keeps a lot of people away from exactly the kind of training that moves grip numbers in the right direction.
Free download: our Metabolism Starter Kit — a protein calculator, a 7-day meal framework, and a one-page supplement checklist, with zero hype.
Get the Free Starter Kit →If your numbers landed below the median for your age, grip responds quickly to progressive pulling work. The Ultimate Pull-Up Program is a progressive plan for building grip and pulling strength safely, with regressions for beginners.
Learn More →Affiliate link — we may earn a commission at no extra cost to you. Disclosure
Frequently Asked Questions
What is a good grip strength for my age?
Pooled international data shows average absolute grip strength peaks between ages 30-39 at roughly 49.7 kg for men and 29.7 kg for women, then declines gradually, with the decline accelerating from middle to late adulthood. Your own “good” number also depends on height and body size, which is why clinical reference tables use regression equations rather than one flat number per decade.
Does grip strength really predict how long you’ll live?
Grip strength correlates with health outcomes including mortality risk in large population studies, which is why it’s used as a screening marker — but correlation isn’t the same as grip strength directly causing longevity. We cover this distinction in detail in our dedicated grip-strength-and-longevity article.
Why is my grip weaker in one hand than the other?
A gap between dominant and nondominant hand grip is normal and shows up consistently across the normative studies cited here. Track each hand separately against its own baseline rather than comparing your weaker hand to your stronger one.
Can I compare my grip strength to charts from other countries?
Be cautious. Normative studies have found that grip strength reference values differ meaningfully between countries and populations, so a chart built from one country’s data may not transfer accurately to you. US-specific or large international pooled datasets, like the ones cited in this article, are more reliable starting points.
How often should I re-test my grip strength?
Every 3-6 months is reasonable for tracking a meaningful trend. Grip strength doesn’t change dramatically week to week, so more frequent testing mostly adds noise rather than useful signal.
This article is for informational purposes and is not medical advice. A single low grip-strength reading can have many causes; talk to your doctor if you notice a sudden or significant decline. See our Medical Disclaimer.